Feature #6257
closedReview calculated statistics in timeline
20%
Description
It may well be that some calculated columns/aggregations in timeline are superfluous or not useful. Review needed.
Files
Related issues
Updated by Pavel Kácha almost 5 years ago
- Related to Feature #4609: Arbitrary grouping and sorting in Events added
Updated by Pavel Kácha almost 5 years ago
My thoughts, only proposition, open for discussion.
- Totals
- One of key measures.
- For timeline can be calculated relatively quickly (count(*) ... group
by). - For statistician data it's small simple value.
- Keep.
- Recurrences
- I'm not sure if its useful in its current form. Pie chart is almost
always 100%. Bars may show that in some specific time there was a peak
in recurrent events, alas there's no possibility of finding out which
ones (apart from trying to correlate with columns on other graphs with
possibly different scales and the drilling into Alerts searches). - As i understand it, it needs some consultation with relapse
cache during calculation, which might be costly . - If we accept classes as first class citizen (pun not intended), partial
information can be visible from graph (sans source) - I incline to ditching it.
- I'm not sure if its useful in its current form. Pie chart is almost
- Abuses
- Now makes sense only for constituency admins (like us).
- Usable for abuse team admins only after we have hierarchical networks.
- Keep, we'll need it in the future.
- Analyzers
- Names of analyzers are completely arbitrary, often cryptic.
- Useful only for constituency admins (like us).
- Ditch.
- ASNs
- I believe this is used very seldomly.
- Not sure if useful for security/forensics team work.
- However nice in graphs...
- ... if accompanied with company name.
- Not sure.
- Categories
- Straightforward (one category).
- Problem with ambigous statistics (sum is more than number of events).
- Personaly I've never used it, always used category sets.
- Calculable from Category sets statistics, if needed.
- For my part, ditch.
- Category sets
- One of key measures.
- Statistics sums up.
- Useful would be possibility to merge some category sets, like 'omit
Test, group the rest'. - Keep.
- Countries
- Same as ASNs.
- Isn't this derivable from ASNs? (For stats precalculation.)
- Not sure.
- Detectors
- One of key measures.
- Keep.
- Detector software
- Similar to analyzers.
- Moreover, most of the clients have only one SW behind (except Filers, which we don't care dearly for.)
- Ditch.
- IPs
- One of key measures.
- Rename to Sources?
- Keep.
- Classes
- Mmmkay.
- Not convinced strongly, but let's keep.
- Severities
- Also not sure, if useful in current form. Bars may show that in some
specific time there was a peak in recurrent events, alas there's no
possibility of finding out which ones (apart from trying to correlate
with columns on other graphs with possibly different scales and
drilling into Alerts searches). - Have anybody ever used this stats?
- Ditch?
- Also not sure, if useful in current form. Bars may show that in some
We don't have:
- Ports
- Would be nice for spotting rise of attacks to specific ports.
- Add?
- Services
- (Un)fortunately it's partially orthogonal to ports.
- Would be nice for spotting rise of attacks to specific services.
- Add?
- Targets
- Doesn't it make sense for network admins to see their hotspots?
- Add?
Updated by Pavel Kácha almost 5 years ago
- To be discussed changed from No to Yes
Updated by Jan Mach over 4 years ago
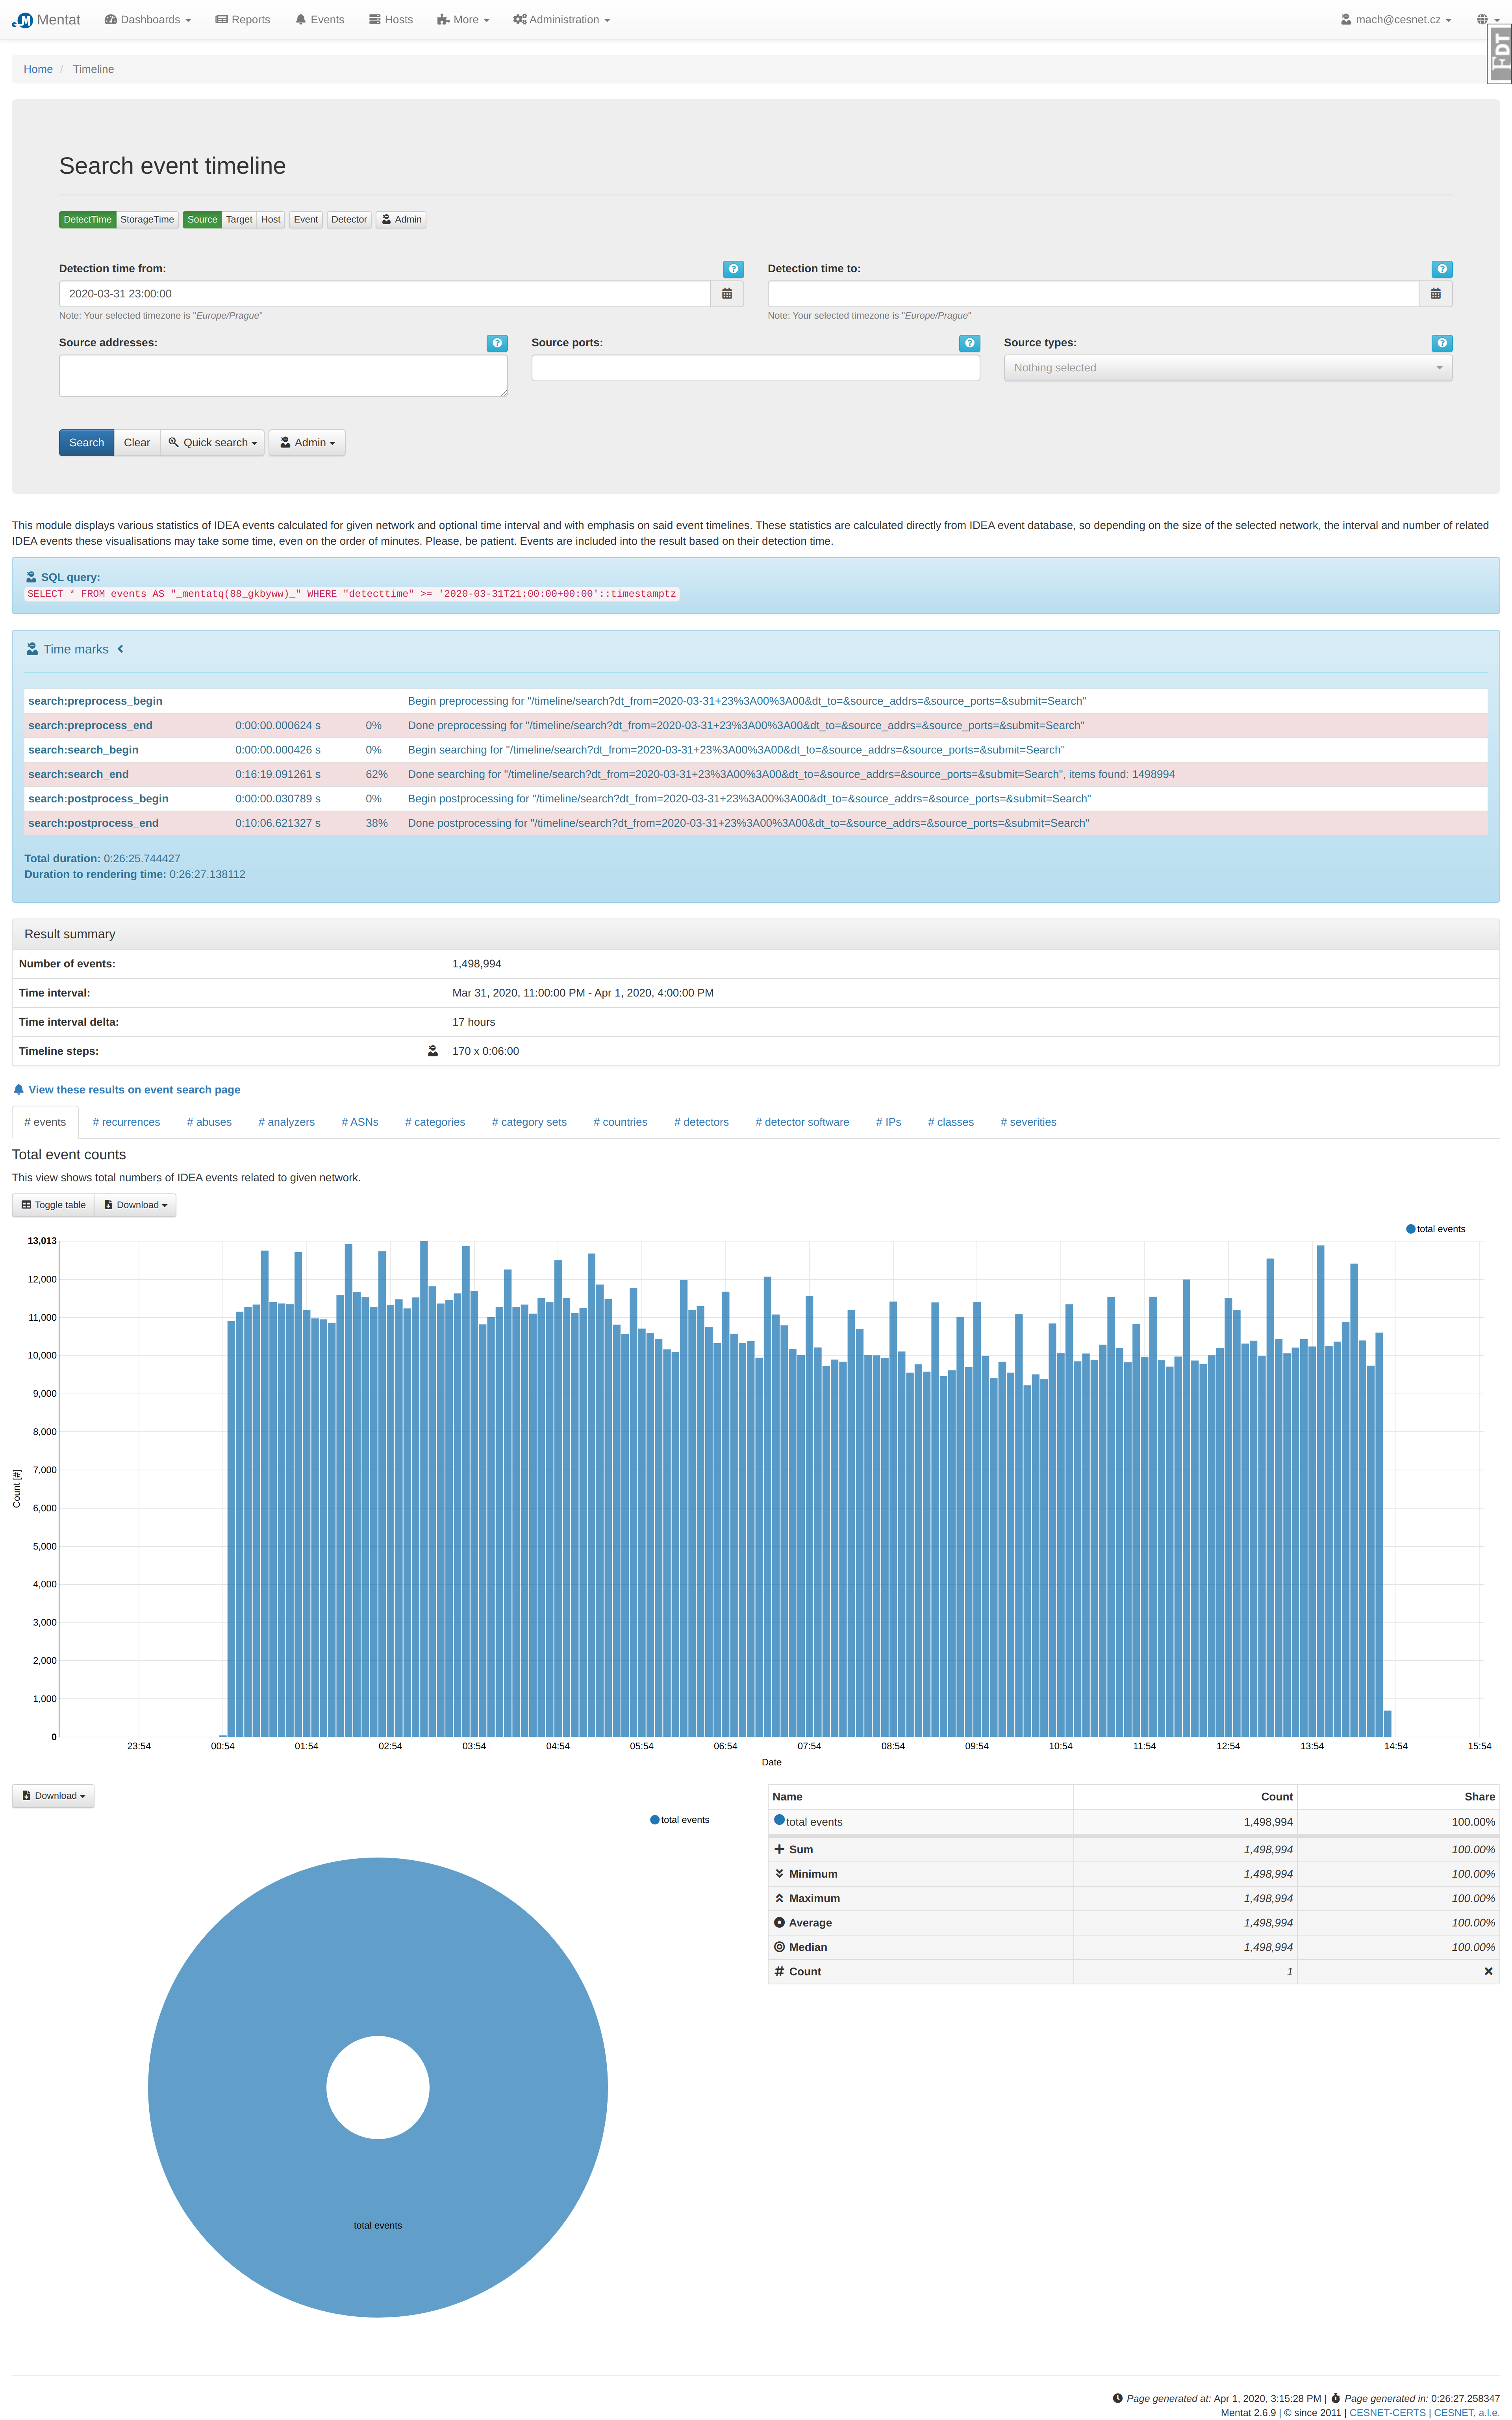
- File screencapture-mentat-alt-cesnet-cz-mentat-timeline-search-2020-04-01-15_27_13.png screencapture-mentat-alt-cesnet-cz-mentat-timeline-search-2020-04-01-15_27_13.png added
- File screencapture-mentat-alt-cesnet-cz-mentat-timeline-search-2020-04-01-15_28_36_profiler.png screencapture-mentat-alt-cesnet-cz-mentat-timeline-search-2020-04-01-15_28_36_profiler.png added
- % Done changed from 0 to 10
According to the Pavel`s recommendation I have done example query including time measurement and profiling. Results are in attached files.
Number of events:     1,498,994
Time interval:        Mar 31, 2020, 11:00:00 PM - Apr 1, 2020, 4:00:00 PM
Time interval delta:  17 hours
Timeline steps:       170 x 0:06:00

Query:
SELECT * FROM events AS "_mentatq(88_gkbyww)_" WHERE "detecttime" >= '2020-03-31T21:00:00+00:00'::timestamptz

Time marks :
search:preprocess_begin
search:preprocess_end     0:00:00.000624 s    0%
search:search_begin       0:00:00.000426 s    0%
search:search_end         0:16:19.091261 s    62%
search:postprocess_begin  0:00:00.030789 s    0%
search:postprocess_end    0:10:06.621327 s    38%

Total duration: 0:26:25.744427
Duration to rendering time: 0:26:27.138112
Updated by Pavel Kácha over 4 years ago
- Assignee changed from Pavel Kácha to Radko Krkoš
From today's video meeting:
- From timemarks is seems like DB query is long, calculations are shorter. However, from 'search' part comprises also creating lite Idea objects (typedcols, ipranges) and some jpath accesses, which seems to take most of the data fetching part. So the possibilities:
- Somehow get rid of the object creation and abstraction layers, however even though it might shortcut most of the processing, it would also sidestep most of the logic and go against the Hawat architecture.
- Somehow coerce PostgreSQL to do the calculations itself and hand back just final data.
So, Radko will try to come up with some queries, calculating data for graph, and roughly estimating performance, then we'll evaluate next steps.
Updated by Pavel Kácha over 4 years ago
Also, discussion of grouped categories appreciated.
Considering recurrence - combined aggregation of IP + class might show interesting toplist of recurrent events.
Updated by Radko Krkoš over 4 years ago
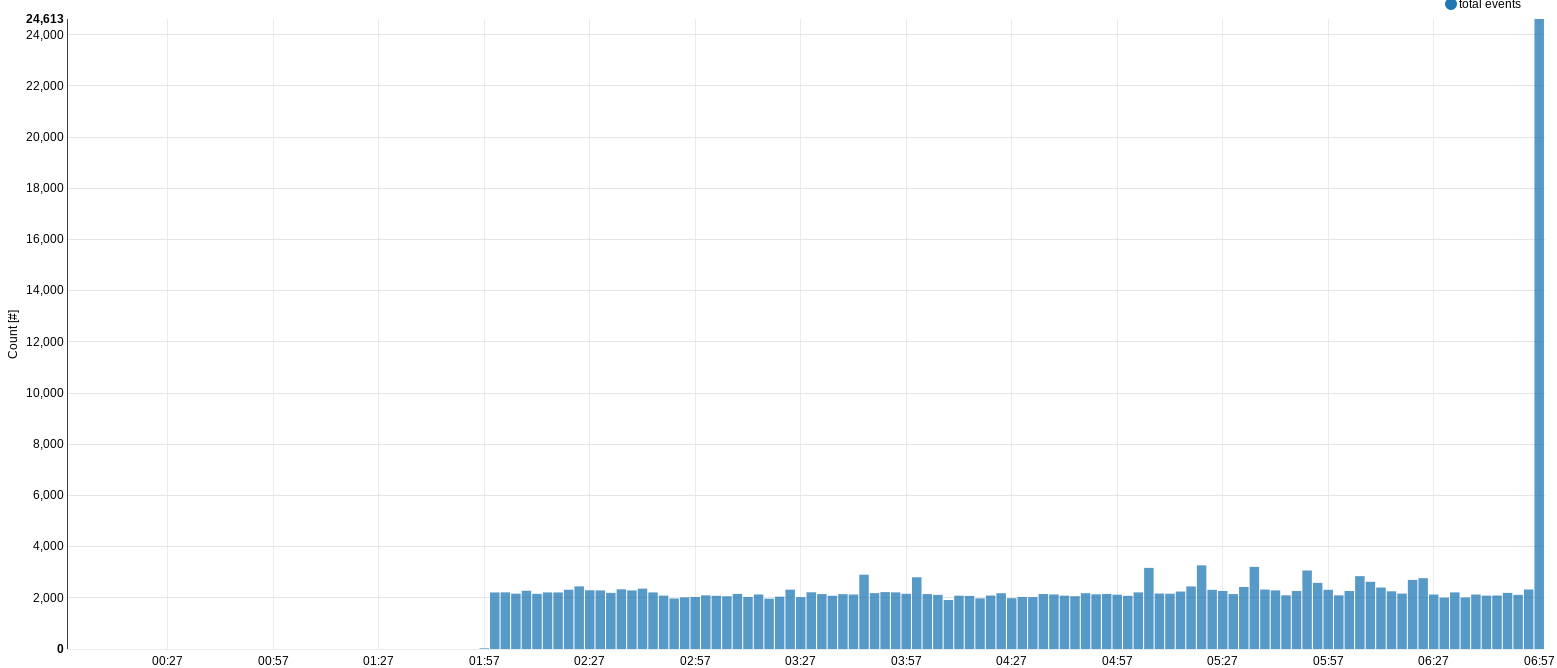
- File mentat_timeline_bug.png mentat_timeline_bug.png added
- % Done changed from 10 to 20
The analytic queries have been developed according to the currently presented results. The performance was assessed.
As a baseline, let's select a plain query for the then current day, 00:00:00 - 06:00:00. The current result is available here:
https://mentat-alt.cesnet.cz/mentat/timeline/search?dt_from=2020-04-08+00%3A00%3A00&dt_to=2020-04-08+06%3A00%3A00&source_addrs=&source_ports=&submit=Search
To obtain the same results, we need several queries, the primary:
SELECT '2020-04-08 00:00:00'::timestamp + '3 mins'::interval * (-1 + width_bucket(detecttime, (SELECT array_agg(buckets) FROM generate_series('2020-04-08 00:00:00'::timestamp, '2020-04-08 06:00:00', '3 mins'::interval) AS buckets))) AS bucket, COUNT(*) FROM events WHERE detecttime > '2020-04-08 00:00:00' AND detecttime < '2020-04-08 06:00:00' GROUP BY bucket ORDER BY bucket;
- took ~150ms.
SELECT '2020-04-08 00:00:00'::timestamp + '3 mins'::interval * (-1 + width_bucket(detecttime, (SELECT array_agg(buckets) FROM generate_series('2020-04-08 00:00:00'::timestamp, '2020-04-08 06:00:00', '3 mins'::interval) AS buckets))) AS bucket, events.cesnet_resolvedabuses AS abuses, COUNT(*) FROM events WHERE detecttime > '2020-04-08 00:00:00' AND detecttime < '2020-04-08 06:00:00' GROUP BY bucket, abuses ORDER BY bucket;
- took ~800ms.
unnest() can be used like this:
SELECT '2020-04-08 00:00:00'::timestamp + '3 mins'::interval * (-1 + width_bucket(detecttime, (SELECT array_agg(buckets) FROM generate_series('2020-04-08 00:00:00'::timestamp, '2020-04-08 06:00:00', '3 mins'::interval) AS buckets))) AS bucket, unnest(events.category) AS cat, COUNT(*) FROM events WHERE detecttime > '2020-04-08 00:00:00' AND detecttime < '2020-04-08 06:00:00' GROUP BY bucket, cat ORDER BY bucket;
- took ~800ms.
SELECT '2020-03-01 00:00:00'::timestamp + '8 hours'::interval * (-1 + width_bucket(detecttime, (SELECT array_agg(buckets) FROM generate_series('2020-03-01 00:00:00'::timestamp, '2020-04-01 00:00:00', '8 hours'::interval) AS buckets))) AS bucket, COUNT(*) FROM events WHERE detecttime > '2020-03-01 00:00:00' AND detecttime < '2020-04-01 00:00:00' GROUP BY bucket ORDER BY bucket;
- took ~6s.
SELECT '2020-03-01 00:00:00'::timestamp + '8 hours'::interval * (-1 + width_bucket(detecttime, (SELECT array_agg(buckets) FROM generate_series('2020-03-01 00:00:00'::timestamp, '2020-04-01 00:00:00', '8 hours'::interval) AS buckets))) AS bucket, cesnet_resolvedabuses AS abuses, COUNT(*) FROM events WHERE detecttime > '2020-03-01 00:00:00' AND detecttime < '2020-04-01 00:00:00' GROUP BY bucket, abuses ORDER BY bucket;
- took ~15s.
SELECT '2020-03-01 00:00:00'::timestamp + '8 hours'::interval * (-1 + width_bucket(detecttime, (SELECT array_agg(buckets) FROM generate_series('2020-03-01 00:00:00'::timestamp, '2020-04-01 00:00:00', '8 hours'::interval) AS buckets))) AS bucket, unnest(category) as cat, COUNT(*) FROM events WHERE detecttime > '2020-03-01 00:00:00' AND detecttime < '2020-04-01 00:00:00' GROUP BY bucket, cat ORDER BY bucket;
- took ~17s.
- Remark: The run times also depend on the number of distinct array values (the aggregate dimensions).
The queries are parametrized by 4 values: start and end time (which are user input), the interval time, which is presumably already determined by some magic, and the optional additional column. Based on the runtimes, it should be practical to get the results per screen on user request.
If just an interval index since the beginning is required (based on how the graphing is implemented), the query can be simplified as follows:
SELECT width_bucket(detecttime, (SELECT array_agg(buckets) FROM generate_series('2020-04-08 00:00:00'::timestamp, '2020-04-08 06:00:00', '6 minutes'::interval) AS buckets)) AS bucket, COUNT(*) FROM events WHERE detecttime > '2020-04-08 00:00:00' AND detecttime < '2020-04-08 06:00:00' GROUP BY bucket ORDER BY bucket;
This version is somewhat faster due to simpler sorting.
Also, calculation inside DB would help getting rid of yet another incarnation of the timezone bug. At least for me, the graph looks like in the attachment - the bins are shifted 2 hours to the future relative to data obtained.
Updated by Pavel Kácha over 4 years ago
Just a note - is ORDER BY clause really necessary? I believe that the result for frontend will be dict of dicts and order of data processing doesn't matter.
Updated by Radko Krkoš over 4 years ago
Pavel Kácha wrote:
Just a note - is ORDER BY clause really necessary? I believe that the result for frontend will be dict of dicts and order of data processing doesn't matter.
Yes, I wanted to discuss that, but have forgotten.
My thinking is also that it should be left out. Also, the bucket column is now calculated as a timestamp. If just a bucket index would be enough, the calculation could be left out, shaving off some time.
Updated by Pavel Kácha over 4 years ago
Radko Krkoš wrote:
Pavel Kácha wrote:
Just a note - is ORDER BY clause really necessary? I believe that the result for frontend will be dict of dicts and order of data processing doesn't matter.
Yes, I wanted to discuss that, but have forgotten.
My thinking is also that it should be left out. Also, thebucketcolumn is now calculated as a timestamp. If just a bucket index would be enough, the calculation could be left out, shaving off some time.
Okay, I'll leave the decisions on your and Mek's discussion during implementation.
Updated by Pavel Kácha over 4 years ago
Also, somewhere on the course of implementing #6308 (before or after) we should incorporate changes/removes/additions from #6257#note-2.
Updated by Radko Krkoš over 4 years ago
- Assignee changed from Radko Krkoš to Pavel Kácha
After discussion, now that I understand it more:
Pavel Kácha wrote:
- Totals
- One of key measures.
- For timeline can be calculated relatively quickly (count(*) ... group
by).- For statistician data it's small simple value.
- Keep.
Definitely keep, this is the first level of any statistics.
As for the pie (doughnut) chart, I would either leave it out (it is always 100%), or graph individual time slots in it - displays relative distribution of events over the time period, must be done for fewer slots, hundred is too much.
Pavel Kácha wrote:
- Recurrences
- I'm not sure if its useful in its current form. Pie chart is almost
always 100%. Bars may show that in some specific time there was a peak
in recurrent events, alas there's no possibility of finding out which
ones (apart from trying to correlate with columns on other graphs with
possibly different scales and the drilling into Alerts searches).- As i understand it, it needs some consultation with relapse
cache during calculation, which might be costly .- If we accept classes as first class citizen (pun not intended), partial
information can be visible from graph (sans source)- I incline to ditching it.
I am not sure how to calculate that, not even algorithmically, surely not in the DB, so I would be for ditching it also.
Pavel Kácha wrote:
- Abuses
- Now makes sense only for constituency admins (like us).
- Usable for abuse team admins only after we have hierarchical networks.
- Keep, we'll need it in the future.
- Analyzers
- Names of analyzers are completely arbitrary, often cryptic.
- Useful only for constituency admins (like us).
- Ditch.
I incline on keep, this might be useful for some Warden related outputs, Warden client cleanup work and such.
Pavel Kácha wrote:
- ASNs
- I believe this is used very seldomly.
- Not sure if useful for security/forensics team work.
- However nice in graphs...
- ... if accompanied with company name.
- Not sure.
- Categories
- Straightforward (one category).
- Problem with ambigous statistics (sum is more than number of events).
- Personaly I've never used it, always used category sets.
- Calculable from Category sets statistics, if needed.
- For my part, ditch.
We discussed the "inverse Aristotelian dissonance" and the calculation should be changed to relative portion of the whole, therefore not inflating the total count. Then the result is something that was requested in SABU. I would keep this, with the changes.
Pavel Kácha wrote:
- Category sets
- One of key measures.
- Statistics sums up.
- Useful would be possibility to merge some category sets, like 'omit
Test, group the rest'.- Keep.
While adding conditions like that is trivial, I am not sure how to represent that in the UI. The Test category is special, maybe have another view, sans all Test events? That could be useful for decisions around migrating Warden clients from test or how much effort to allocate to them.
Pavel Kácha wrote:
- Countries
- Same as ASNs.
- Isn't this derivable from ASNs? (For stats precalculation.)
- Not sure.
This looks nice in presentations. Then, there were cases of geographic filtering on repackaging Warden sources in the past, so it might be (heavily) skewed, so the utility is questionable.
Pavel Kácha wrote:
- Detectors
- One of key measures.
- Keep.
- Detector software
- Similar to analyzers.
- Moreover, most of the clients have only one SW behind (except Filers, which we don't care dearly for.)
- Ditch.
- IPs
- One of key measures.
- Rename to Sources?
- Keep.
I agree with the rename, especially if the Target IP statistics would be added (and I agree with that).
Pavel Kácha wrote:
- Classes
- Mmmkay.
- Not convinced strongly, but let's keep.
- Severities
- Also not sure, if useful in current form. Bars may show that in some
specific time there was a peak in recurrent events, alas there's no
possibility of finding out which ones (apart from trying to correlate
with columns on other graphs with possibly different scales and
drilling into Alerts searches).- Have anybody ever used this stats?
- Ditch?
This could be useful as a high level information in a manager graph somewhere.
Pavel Kácha wrote:
We don't have:
- Ports
- Would be nice for spotting rise of attacks to specific ports.
- Add?
I am for adding this.
Pavel Kácha wrote:
- Services
- (Un)fortunately it's partially orthogonal to ports.
- Would be nice for spotting rise of attacks to specific services.
- Add?
True as the orthogonality argument goes, but might be useful also. And it could help with analysis if any discrepancies between ports and services exist, leading to improving the Warden clients and therefore the system as a whole.
Pavel Kácha wrote:
- Targets
- Doesn't it make sense for network admins to see their hotspots?
- Add?
Definitely.
As a whole, I see the statistics and timelines as a useful tool. Only changes I would ask for are to present relative counts to the whole, instead of inflating the total count, as was discussed. The DB based way of calculation is quite efficient, even for attributes with extreme value ranges (source/target ip arrays), there is a lot of room for expansion of this feature.
Updated by Pavel Kácha over 4 years ago
- Blocked by Feature #6308: Reimplement timeline calculations on database added
Updated by Pavel Kácha over 4 years ago
Lets postpone discussion after finishing #6308, as it involves adding some columns to flat data table.
Updated by Radko Krkoš over 4 years ago
- Related to Feature #6413: Autarkic DB queries for timeline added
Updated by Rajmund Hruška about 4 years ago
Is there still any work to do? I see that the unnecessary statistics are removed and new statistics are added.
Updated by Pavel Kácha about 4 years ago
If I did not miss anything, we dont have yet:
ASNs, Countries
(Not sure.) Nice in presentations, however probably heavily skewed (because of sources of Warden data).
Categories
Should be converted to Category sets, bigger task in itself.
We don't have yet: Services, Targets
(With it should go also renaming of IPs to Sources.)
All these additions would also need adding the column into database, ergo some planning and outage.
I'd either put this into Future, or split aforementioned into their own tickets.
Updated by Radko Krkoš over 2 years ago
- Assignee changed from Pavel Kácha to Jakub Maloštik
- Target version changed from Backlog to 2.11
As per the #note-18, there are some parts left to implement. At least the Services and Targets should not be too difficult.
Updated by Pavel Kácha over 2 years ago
Result from local discussion with Radko:
- Want Targets we do. (As master Yoda succinctly articulates). (And Targets in "metadata" events table already we have.)
- Want ASN and Country we don't . (Yet.) They occupy space, are available only when Enricher is configured in the pipeline (and has correct data), are misleading (it's usually just jumphost, real attack does not in fact go from there), and if we really wanted, we might also consider loading Maxmind data into db table and do calculation on unnested/joined data. Let's drop those for now and leave them for if there is real demand or usecase.
Updated by Rajmund Hruška about 2 years ago
- Status changed from New to In Review
Updated by Rajmund Hruška over 1 year ago
- Status changed from In Review to Closed